
What autoresearch taught us about skin analysis
An AI agent explored wrinkle and pore models, trained small networks, and built review tools. The difficult part was deciding what our labels could tell us.
One pore detector proposed more than a thousand locations in a small nose crop. Another proposed a couple of hundred. Both found many of the examples a person had marked.
The marks alone could not establish which detector was better. They identified some visible pores, not every pore, and they did not tell us which of the remaining detections were wrong. The more densely a model scattered predictions, the easier it became to hit a marked example.
This was the central lesson from an ongoing skin-analysis investigation in which we used an AI coding agent to research methods, implement experiments, inspect outputs, and build tools for human review. The agent let us try approaches that would have taken much longer to implement separately. Our labels could support fewer conclusions than the growing result tables suggested.
What follows is an account of exploratory work through October 15, 2026. It concerns visible image features, not diagnosis or a clinically validated system. The private photographs and annotation files are not included here.
The investigation at a glance
| Question | What the work established |
|---|---|
| What did we try? | Public wrinkle-segmentation baselines, pore detectors, small learned models, and tools for human review |
| What could we compare? | Recorded pipeline behavior and matches to provisional marked centers under stated conditions |
| What remained unknown? | Overall pore precision, whole-region recall, and performance on new people and capture conditions |
| What did we learn? | Prediction density can increase marked-center coverage without establishing better overall accuracy |
The practical lesson is to define what the reference data can establish before treating an experiment table as a ranking. Our workflow assessment explains how we apply that habit to business workflows.
Begin with a problem that has labels
The earlier part of the investigation focused on wrinkle segmentation using public data. A segmentation model predicts which image pixels belong to a feature. Unlike a plausible-looking overlay, an annotated mask allows a defined comparison.
The FFHQ-Wrinkle project provided a concrete starting point: reference annotations, texture inputs, and released U-Net and SwinUNETR checkpoints. We inspected published baselines and used three nested training subsets to check the adaptation pipeline, keeping validation and test image IDs fixed. The runs adapted a weak-texture-pretrained checkpoint whose pretraining may include validation or test source images. The table is therefore a pipeline diagnostic, not an estimate of performance on previously unseen images.
| Labeled training images in our U-Net adaptation | Mean test intersection-over-union |
|---|---|
| 40 | 0.303 |
| 100 | 0.329 |
| 400 | 0.429 |
All three runs used the same 100 test image IDs. Intersection-over-union measures overlap between predicted and annotated pixels; it is not the percentage of people correctly assessed. These were single-seed runs with a fixed epoch schedule, so larger subsets also received more optimizer steps. The comparison does not isolate the causal effect of annotation count, and image separation did not establish identity separation.
The runs showed how this pipeline behaved under recorded conditions, giving us something firmer than choosing the overlay we liked most. They did not establish transfer to different cameras, lighting, or commercial skin-analysis captures. The public dataset's stated noncommercial license also remained a separate consideration from technical performance.
Pores changed the evaluation problem
For the later pore pilot, we worked with high-resolution frontal and side photographs from one apparent person. We extracted native-resolution regions and kept their coordinates so predictions could be mapped back to the original images. A near-duplicate frontal variant was eventually excluded from the simplified comparison view.
The approaches were deliberately varied. Classical blob and curvature filters gave fast candidate locations. A released Pore-Net specialist supplied learned probability maps. Separately logged GPT-6.1 Sol vision requests tested point localization and candidate verification. Prompt-assisted SAM 2 experiments examined boundaries around a few marked centers.
These methods did not all produce the same kind of answer. A candidate center, a connected region in a probability map, and a prompted boundary are different objects. A display circle is not a measured pore boundary. Counting connected components does not resolve structures that merge or split as a threshold changes.
Scale was especially revealing. At one Pore-Net threshold, native-resolution inference produced 1,327 retained nose candidates, while inference at half size produced 229. Changing resolution had changed the apparent task. Neither count could be treated as the number of anatomical pores.
The labels arrived with an important limitation
The first file believed to contain annotations did not yield usable embedded marks. A later screenshot did. We recovered its green markers, registered the screenshot to the original photograph, and inspected the alignment. After excluding the unsupported crop border, 62 provisional marks fell within the nose evaluation region.
That gave us a narrower but useful question: how many of those marked centers did a method find within a fixed pixel tolerance?
It did not give us overall precision, because unmarked predictions could still be real pores. It did not give us whole-region recall, because the total set of real pores was unknown. The markers were also selected by a person and imperfect, rather than an exhaustive, adjudicated reference.
We used one-to-one matching so a single prediction could not claim several nearby marks. We also reported both four- and eight-pixel tolerances. The tolerance is part of the result; increasing it makes the task easier.
This distinction changed how we read the experiment table. Finding 54 of 62 marks with 1,327 proposals was not automatically stronger evidence than finding 52 with 229 proposals. Prediction density was doing some of the work.
Small learned models were worth trying
The next experiments tested whether inexpensive models could filter the candidate pool or predict centers directly. We trained a random forest, patch classifiers, and small center-heatmap networks. These runs used machine-generated weak labels; the human dots were excluded from training and checkpoint selection.
One patch classifier compressed its spatial representation through global pooling. At the reported thresholds it retained either the entire candidate pool or none of it. A variant that preserved the spatial arrangement around the candidate center produced a more selective result. An initial heatmap model collapsed to background; a second run with changed loss weighting and learning rate produced detections. Those simultaneous changes prevent attributing the difference to one factor alone.
For the specialist comparator, we also averaged Pore-Net predictions across eight rotations and reflections, mapped back to the original coordinates, at half scale. This is the averaged configuration below; it differs from the single-pass native and half-scale runs discussed earlier.
Here is a compact view of three configurations we retained for investigation:
| Configuration on the same frontal nose region | Proposals | Matches within 4 pixels | Matches within 8 pixels |
|---|---|---|---|
| Averaged Pore-Net, threshold 0.5 | 211 | 39 / 62 | 53 / 62 |
| Center-preserving patch CNN, threshold 0.7 | 191 | 44 / 62 | 56 / 62 |
| Weighted center heatmap, threshold 0.4 | 259 | 41 / 62 | 54 / 62 |
Scroll sideways to see all columns.
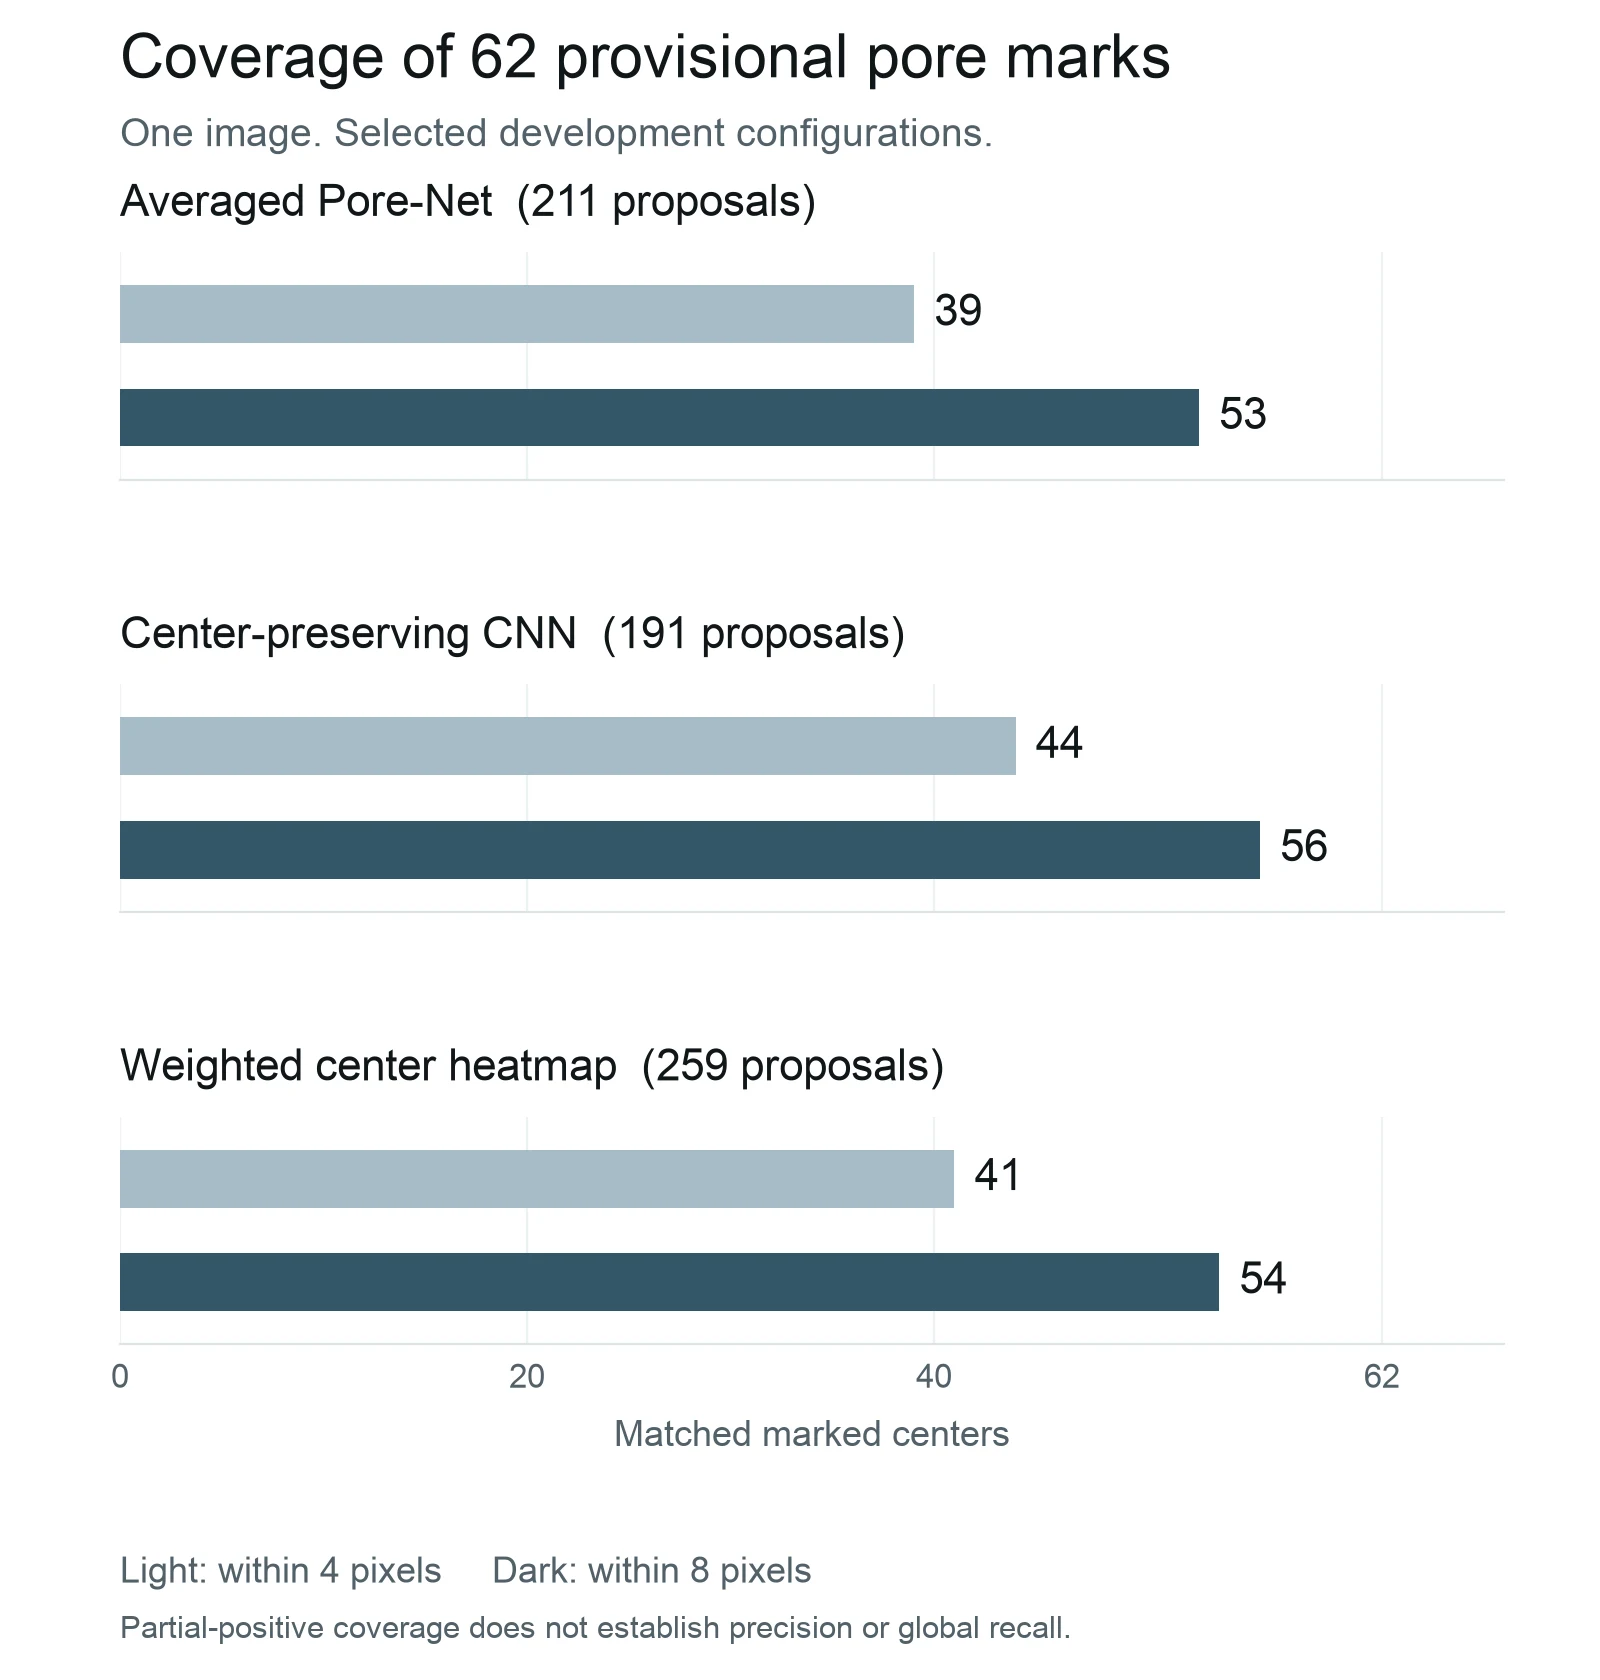
These are selected development configurations, not a final leaderboard. The frontal image had already been inspected, thresholds were not selected on an independent human-labeled validation set, and training and selection views belonged to the same apparent person.
The CNN and the random comparison both selected from the same pool of 1,055 candidates. Across 200 random subsets of 191 proposals, the average was about 12.9 of the 62 marks at eight pixels; the CNN's 191 proposals matched 56. That supports selective retention on this image. It does not tell us whether the other 135 proposals were correct, or predict performance on another person.
The experiment also produced a revealing disagreement: a model that better imitated the weak teacher labels did not necessarily retain more human-marked positives. Agreement with a teacher and agreement with a human reference were measuring different things.
We needed reviewed examples before another model
At this point, another round of model changes risked producing more opinions about the same image.
We built an offline review interface with magnified image regions, hidden predictions on first inspection, and three explicit choices: pore, not pore, and unsure. A simplified mode put three recommended methods beside the same region, supported undo and export, and made it easier to inspect disagreement. The images stayed private; the tool required no external requests.
The evaluator was designed to preserve the distinction between a partially marked region and a fully reviewed one. Partial positives could support marked-example coverage. Precision and recall would only be calculated where the review supplied an exhaustive enough reference. Uncertain features remained unknown rather than becoming convenient negatives.
Synthetic checks verified the evaluator's matching rules and the interface's coordinate handling. Those checks established that the machinery behaved as intended. They were not new human accuracy results. Likewise, a disagreement queue was useful for finding informative examples, but its deliberately biased selection could not become a representative performance estimate.
The next experiment was therefore clear: obtain corrected, fully reviewed regions from several people, separate people across development and evaluation, and compare the promising methods under one agreed definition. Boundary measurements would require their own labels and calibration.
What I would change next time
The agent moved between papers, model code, training runs, and review tools. We could try more ideas and preserve failed experiments without making each one a separate development project.
I would budget for the reference labels earlier. Another model trained against the same weak labels would not answer the questions we still had.
The numerical results above come from our saved experiment artifacts and are exploratory. Public repositories identify the external methods and data sources; they do not independently verify our runs. No private photographs, credentials, or identifying filenames are published with this article.